The Origin of Stock Markets
In 1600, exotic new goods were pouring into European markets from the New World and from Asia. Although these goods were intriguing, the companies bringing them back were even more so. The East India Company and the Dutch East India Company both began to issue shares of ownership in the company, to help fund their adventures. To provide a marketplace for this new kind of "stock" product, the Amsterdam Stock Exchange, founded in 1602. It existed continuously until the year 2000, when it merged with the Paris and Brussels exchanges to form the Euronext exchange.
Meanwhile, in the City of London, the Royal Exchange had opened for trade in 1571 but only dealt in commodities. By the mid-1600's, stock brokers had become numerous in the exchange as well, and were well-known for their numbers as well as for committing fraud. After being expelled from the Royal Exchange, stock brokers they made their trades in coffee houses and in the streets nearby, in an area of London referred to by Daniel Defoe as a place "to do much mischief in fewest words" in 1719. The central street, called "Exchange" or Change Alley, still exists near Bank (Map).

Edward Matthew Ward, "The South Sea Bubble, a Scene in 'Change Alley' in 1720", Tate
Today stocks are traded in dozens of markets around the world. The 16 largest markets are shown below, each with over $1 trillion USD in market capitalisation, a a measure of the sum total price of all the shares available on the market.

Classical Investment Philosophies
The mechanics of purchasing a security are very simple. It's a lot like a farmer's market, accessible by logging into a brokerage account online: you begin by finding a product you're interested in, such as AAPL. You then check the price listings, and make a bid at a price that you think is fair. If a seller accepts your bid, then the trade will be initiated. The money will come out of your cash account, plus typically the cost of a fee charged by your broker, and you will come to own the security.
As an investor, your aim in purchasing securities in a stock market is to make a profit on future sales. How can you do this? There are two classical investment strategies to this question that arose in 20th century investment practice. Each of them has its problems. From a physics perspective, there is a natural alternative to both.
The Fundamentalist Perspective
Humans often make large personal commitments to things even when they have a low price. For example, a shaggy puppy may sell for £20 at the animal shelter, while being worth a great deal more to the person who buys it.

A valuable puppy
Some philosophers have argued this kind of thing indicates the existence of a special underlying property, called value, or in some cases intrinsic value. From this perspective, the puppy may have a price of £20, but much higher value, which makes it appropriate for us to adjust our commitments in a way that goes beyond other £20 things.
The fundamentalist perspective on investment is that similar thinking applies to stock market analysis. A share of a company's stock has a hidden property that goes beyond its price, which is the intrinsic value of the stock, which may make it worthy of purchase in spite of the price.
SEP: Philosophers on intrinsic value
Investopedia: Investors on intrinsic value
Fundamentalists in general disagree about exactly how to measure the intrinsic value of a stock. But they often take into account both qualitative and quantitative factors like the following.
| Liquidation price - How much a company's total assets could be sold for if it were broken up today. |
| Future earnings - How much a company can be expected to earn in the future |
| Future dividends - How much a company can be expected to pay out to its investors in the future |
| Growth rate - A faster growth rate makes earnings at every stage grow more in the long run. (There is some evidence that this is correlated with the measurable P/E or "price to earnings" ratio of a stock.) |
| Degree of risk - Risk is sometimes associated with a lack of age or 'respectability' of a stock, and sometimes also with measurable quantities like a company's ratio of debt to equity, or its beta, a measure of how much its price 'swings' relative to the market. |
| Competitive advantage of a company over its competitors, which may make it more difficult for their market earnings to be challenged. |
After having determined a value of a stock, the basic fundamentalist strategy is to compare that value to the current market price, and make a purchase if price is sufficiently below the value. The basic claim is that this value reliably indicates future price, so that a profit can be made. This fundamentalist strategy was proposed by Benjamin Graham in his influential book The Intelligent Investor. One of the most well-known advocates of fundamentalism more recently has been Warren Buffet, who wrote in his 2008 Chairman's Letter to Berkshire-Hathaway investors:
"Long ago, Ben Graham taught me that 'Price is what you pay; value is what you get'. Whether we're talking about socks or stocks, I like buying quality merchandise when it is marked down."

Investor Warren Buffett
Difficulties with fundamentalism
Buffett has undoubtedly been successful in predicting profitable investments, often beating standard market averages. However, this is not by itself enough to establish that his strategy is correct. In a room full of 1,000 coin flippers, there will almost always be one that experiences a remarkable trend of flipping heads; similarly, 1,000 stock traders making random purchases will almost always produce a winner.
Whether or not the method works, there are number of difficulties with the fundamental analysis approach.
One philosophical difficulty is about the status of 'value' as a property of stock. Since value is not a directly measurable property, there is disagreement about what exactly it refers to. As a consequence, many fundamentalist investors assign different "value" to the same stock. This combination of empirical inaccessibility and disagreement makes it difficult to see why value is an objective property of a stock. One worries that this 'value' concept may be a bit like an invisible friend that an investor claims to know a great deal about, but which nobody else can see.

Jimmy Stewart speaks to his invisible giant rabbit friend in Harvey (1950)
If on the other hand it is just a simple heuristic for making predictions about price, then it would appear to be one's ability to predict future price that matter, rather than the concept of value itself. Some considerations in the table above involve appeal to non-empirical and otherwise dubious claims about the nature of a company, which make their relevance for prediction equally dubious.
Moreover, there is a basic tension in the approach: in order for it to lead to profitable returns, fundamental analysis requires that value is different from price now, but not in the future. Without a clear indication of when value and price do and do not converge, it remains possible that it will not lead to profitable investments.
The Chartist or 'Technical Analyst' Perspective
An alternative approach to investing is known as the 'chartist' or 'technical analysis' technique. But don't be fooled by the name: being 'technical' does not necessarily make the analysis more reliable or scientific.
Many scientists have built their successful predictions on past data. For example, Tycho Brahe developed accurate predictions about the motion of astronomical bodies by collected an extraordinary amount of past data about those motions. Nate Silver developed remarkable predictions of US election outcomes using past data about the success of polls. This suggests an approach on which we try to simply predict future prices using a data set, instead of trying to understand why that price changes the way it does.
Motivated by this kind of thinking, chartists or 'Technical Analysts' make predictions about the future price of a stock on the basis of trends in the stock's past price. When the technique became popular in the 1970's, chartists would labour to create elaborate hand-drawn tables and charts with which to make their judgements. Today charts are more often created and identified using computers, and even form the basis for many automated trading purchases.
:max_bytes(150000):strip_icc()/dotdash_Final_How_to_Trade_the_Head_and_Shoulders_Pattern_Jul_2020-01-d955fe7807714feea05f04d7f322dfaf.jpg)
A classic 'Head and Shoulders' chart
The above chart is a typical example of one used by chartists. The idea is that, after an initially upward trend, a stock price has a tendency not to rise above a certain level, a phenomenon they refer to as resistance. It tries to peak two more times, but meets resistance each time. On its final way back down it forms something like the "head and shoulders" chart above. According to chartists, this is a clear sign that the stock price is about to plummet. So, sell! Whatever the price-difference from the "neckline" to the "head", that is how much they predict the price will fall once it pierces the neckline.
Chartists sometimes justify their predictions by observing that investors tend to remember their purchase price. For example, in the chart above, the repeated occurrence of an upward trend may lead a large number of investors to purchase the stock. When it finally drops below the neckline, all those investors abandon ship at once in order to avoid going far below their purchase price. This simultaneous sell-off then drives the price of the stock down.
There are dozens upon dozens of charts used in technical analysis. There are many books devoted to the subject. A summary of several more chart analyses is indicated below.

Some examples of charts used in technical analysis
Technical analysis claim these sorts of indicators can be helpful predictors. For example, one technical analysis textbook author writes that the aim of technical analysis is "to help determine the highest-probability reactions to past and current price movement, as well as likely future price movement" (Chen 2010). This means that chart purists, who use only this analysis, must believe that past price trends capture all information that could possibly be relevant to predicting a stock's future price.
Difficulties with Technical Analysis
To begin to see the difficulty with technical analysis, consider their use of the Fibonacci sequence, a famous sequence in number theory that is often found in the description of population and growth phenomena in nature:
| 1 | 1 | 2 | 3 | 5 | 8 | 13 | 21 | ... |
A term in the Fibonacci sequence is generated by adding the two previous terms. It turns out that the ratio of consecutive terms \(F_i/F_{i-1}\) in the sequence approaches the Golden Ratio \(\phi = (1+\sqrt{5})/2\) (approximately 1.61803), another important ratio that is often found in nature.
A common Chartist principle is that the inverse of the golden ratio \(1/\phi \approx 0.618\) provides a bound on how much a stock price can fluctuate within a trend. For example, if the Chartist thinks a downward trend is occurring, then they will often say that stock may fluctuate up by 61.8%, "retracing" its previous steps, before continuing the trend back down. This claim is sometimes referred to as Fibonacci retracement. Any more than this percentage would be a sign to a Chartist that the trend has ended.

It is hard to see any sense in which this is anything more than mere numerology. It is akin to astrologers using statements about the "zodiac" or apparent position of the sun against the celestial sphere, a position known to be arbitrary since the discovery of the heliocentric solar system, to guess your future fortunes. Technical analysts sometimes even admit this:
"Many people who are unfamiliar with the applications of Fibonacci retracements wonder why price action often reacts significantly to these retracement percentages and why so many traders believe in what appear, on the surface, simply to be magic numbers. ... [M]any traders, both large and small, utilise Fibonacci in their trading. As a result, the levels derived from these popular retracement percentages have become somewhat of a self-fulfilling prophecy" (Chen 2010, p.164)
In short, technical analysis has an incredibly thin empirical basis, relying heavily on anecdotal evidence, numerology, and the madness of crowds in their predictions.

Humans find patterns: The Virgin Mary in a piece of toast
Moreover, there is a ready explanation for the persistence of Chartism: humans see patterns to an incredible degree when there is no underlying mechanism creating the pattern. For example, we see can see faces in the clouds. More strikingly, the piece of toasted sandwich bread above sold on eBay for around $28,000 because somebody thought it looked sufficiently like an image of the Virgin Mary. Similarly, consider the following chart:
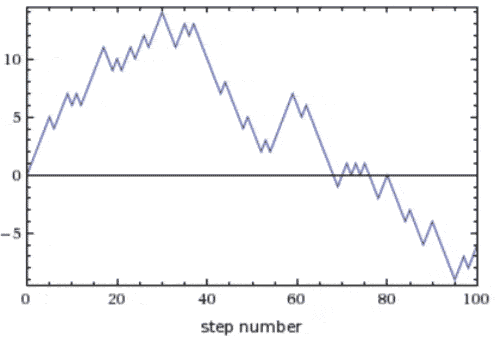
A randomly generated stock pattern
It is possible to identify clear downward trends, W-patterns, Fibonacci retracement, and many other things in this chart. But I have literally generated it from a random walk. You can generate your own "Random Walk Chart" by going to WolframAlpha. Every rule that is formulated about random walk charts is broken by another random walk chart, since they are, after all, random.
Of course, if a chartist technique makes correct predictions, then there is perhaps less of a problem. But a further, more fundamental barrier to this is that factors besides past price may influence future price. Many of the factors that a Fundamentalist considers important for the prediction of future price are ignored by Chartists, not to mention the psychology of the individual buyers and sellers. Their response is typically that past and current price already incorporates all this information. However, little evidence has been produced to confirm this.
Moreover, the evidence about the success of chartist techniques is controversial. Early studies, such as Fama and Bloom (1966), indicate that chartist techniques are unreliable. More recent studies like Neely, Weller and Dittmar (2009) indicate that there are cases where it is successful. However, surveys discussed in the same study indicate that around 90% of currency exchange traders place important weight on chartist techniques, and buy or sell accordingly. So, there is a sense in which chartism may enjoy a self-fulfilling kind of success, but one which is finicky, in that it depends a great deal on current fads in finance.
Brownian Motion in the Stock Market
Suppose an physicist were to ask how a market behaves. The physicist picks up a copy of the Wall Street Journal, or at least navigates to their website, and finds the page describing information about the New York Stock Exchange after the last trading day ended. Plausibly, the physicist would have no idea what governs the underlying dynamics of individual trades, and has absolutely no access to such information. But, being a physicist, the first reaction is to try to understand the relevant parameters, as well as the relationship between the large-scale and small-scale descriptions of these phenomena.
This turns out to be exactly what astrophysicist Maury Osborne did in 1956, and the result was a groundbreaking article called "Brownian Motion in the Stock Market", which has come to provide an interesting alternative to both Fundamentalism and Technical Analysis in stock pricing theory.
We will build up his model in a few steps: first with a plausible understanding of the "inaccessibility" of trades, and then turning to how to "embrace our ignorance" of this fact.
The inaccessibility of trades
Stepping back from Fundamentalism and Chartism now, let's return to the question of what determines the price of a trade, mechanically speaking. For a trade to occur, both the seller and the buyer have to agree on a price. As with everything, stock prices depend on what people are willing to pay. So, what determines that? What indicates whether or not traders are willing to buy, say, stock in Google, or Facebook, at any given price? Relatedly, what determines which sandwich you choose at the sandwich aisle?
 It is ultimately the psychological state of the participants in the trade. A trade is a complicated psychological event that depends on the personal thoughts and actions of the participants in the trade. Moreover, there are generally millions of traders participating in this kind of event at once. When considering whether to purchase something we draw on our past judgements, current information, and in the end may just turn on a gut feeling as to whether or not we'll put the money up. It's an extremely difficult thing to measure on an individual scale. And on the scale of millions of traders in a market, it is an effect that is completely invisible.

However, all of those small trade events may add up, as long as each one has some small effect on the price of the stock. Some traders give the stock's price a tiny upward push, and others a tiny downward push. But when you put all of them together, they can have a large, measurable effect. How large? Very large.
In the Amsterdam Stock Exchange, a given stock (like stock in the Dutch East India Company) could have dozens of shares change hands each day. By the mid 1950s, stock like Ford Automotive was being traded as much as 1,000 times a day. Today, it can be tens of millions. Below is a chart indicating a typical volume of shares traded for a few NASDAQ stock exchange companies.
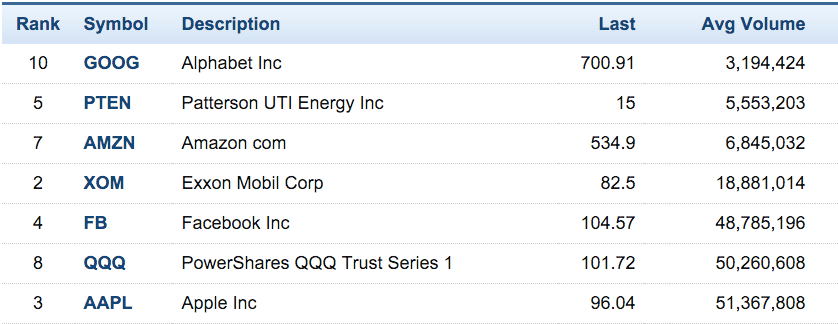
In other words, stocks are impacted by millions of trades per day, each of which causes the stock to experience a tiny shift upward or downward.
Not only that, but it seems that to a good approximation, the traders can be thought of as making independent judgements. They don't often communicate with each other, and they have completely different background histories that may lead to very different judgements about whether they want to buy a stock. If that's right, then a typical stock in the market is being constantly bombarded by millions of tiny effects, each of which tend to push the price up or down.
Does this sound familiar? It's exactly the same situation that we were in when we described a sugar molecule suspended in water. And we have now proposed reasons for treating it as exactly like a random walk.

Thus, sugar molecules are analogous to stocks, being jostled about by millions of tiny effects, while human trading decisions are like water molecules, invisible but having a steady effect that can be measured in aggregate.
This allows us to postulate something incredible. Even though we may have no idea whatsoever about what the causes of a stock price shift amount to, because they're hidden in the psychology of millions of independent humans, we can still make a substantial claim about what will happen to the price of a stock over time.
But price does not randomly walk
The random price hypothesis (false). The price of a stock over time follows a random walk.
Let's begin by observing what is not a problem, at least, not any more than it is in physics. It does not seem to be a problem that the behaviour of a stock price is not truly random. After all, the motion of a sugar molecule is not truly random either. But we are still justified in modelling it this way due to our ignorance about a uniform collection of independent effects.
However, if a price starts out low enough and truly follows a random walk, then the price becomes negative on some of the random walks. But although it is possible to gain or lose money, a price is never negative: the lowest value that it can take is zero. So, the hypothesis seems to incorporate an inaccuracy.

A random walk that drops that starts at 0 and later becomes negative
Perhaps this is just a practical difficulty: we could imagine artificially setting the zero value to be far away from the starting value, so that the number of random steps that the price takes can never practically dip below zero.
A second, more subtle difficulty is the following. Suppose that a number of people are compelled, by some psychological effects, to be willing to buy a stock for £11 instead of £10. If prices follow a random walk, then those same psychological effects will on average amount to a certain fixed 'step size' associated with a change in price. In the present case, the step-size is £1. This means that the same aggregation of human psychological tendencies is applied to a £100 stock, it will give rise to a step change of £1 as well, pushing the price up to £101 instead of £100 (if the change is positive).
But that is an inappropriate behaviour for stock price changes. For a £100 stock, a difference of £1 is not a significant different; at least, not as significant as it is for a £10 stock. One would in general expect the same aggregate psychological effect to have a larger effect on the £100 stock, such as raising the person's willingness to £110. Think about seeing a price change at a shop: if a cocktail price changes from £10 to £11, it is much more noticeable than when a yacht-price changes from £100,000 to £100,001. The percentage matters; thus, the 'equal step size' feature of the random price hypothesis seems to fail.

Finally, there is a problem arising out of another disanalogy with the sugar molecule. In the case of a sugar molecule, we can be assured that the water molecules are more or less directly impacting the sugar. So, we can rest assured that the effect is immediate. In contrast, the human psychology that gives rise to stock change is highly indirect, passing through many different channels and decision-makers before it finally comes to have an effect on price.
This might lead one to wonder: is the randomising effect of human psychology really having a direct impact on a stock? Or might it be having an influence on something else, which then in turn influences the stock? The answer is yes. Let us now see how.
Random rate of return hypothesis
Fortunately, there is an alternative to the random price hypothesis that is in the same spirit, but avoids most of these problems. To warm up, let's think for a moment about the concept of interest.

If you have a savings account, you may notice that when you have some money in there, the bank will actually some additional money into the account. The reason is that, although it doesn't really effect us much, banks are using your money, the very money you deposited in your savings! They use this money to make loans, such as a loan for a person to buy a house. Someone taking out such a loan pays the bank a lot of money for the opportunity, which is one way banks make money. But the bank promises to put the money back whenever you need it, and as payment for letting them use it in this way, they pay you interest.
The amount of money they pay you will keep compounding with each deposit, with more and more being deposited each time. The ideal, continuous increase of money in this way is called continuously compounded interest. A sum of money \(P\) that grows in this way at an interest or rate of return \(r\) will grow exponentially with time \(t\),
\[ P = e^{rt}, \]where \(e\) is called Euler's number, equal to approximately 2.718 (Optional: More on continuously compounded interest).
Like the price of a loan, a stock price can also viewed as compounding continuously. But the rate of return changes as investors make buying and purchasing decisions in a market, and it can sometimes be negative. For example, from the end of 2015 and into early 2016, there were various indicators of lagging sales at Apple. In such periods, an individual investor may decide not to buy Apple, giving rise to a slight negative effect on their rates of return. At more optimistic times the investor might have made the purchase, giving rise to a positive effect.

If the rate of return is positive, it leads to an exponentially increasing price, like interest on a loan. But a negative rate of return leads to an exponential decrease in price. How can we understand the way a stock or bond's rate of return changes over time? This question can be answered by telling a story about millions of trades as suggested above.

Suppose that the complicated psychological judgements described above has a direct effect on the rate of return of a security. Since we have already assumed that such judgements number in the millions and are approximately independent, this suggests a rate of return model for how to describe price statistics.
A changing rate of return that gives rise to an exponential change in price is equivalent to the logarithm of the price changing with the rate of return, since the inverse of an exponential is a logarithm. This suggests the following.
Random rate of return hypothesis. The rate of return will follow a random walk over time; or, equivalently, the logarithm of the price will follow a random walk over time.
Given the random price hypothesis, we can infer all the interesting properties that follow from random walk behaviour. In particular, we know that on average, rates of return will follow a normal distribution.
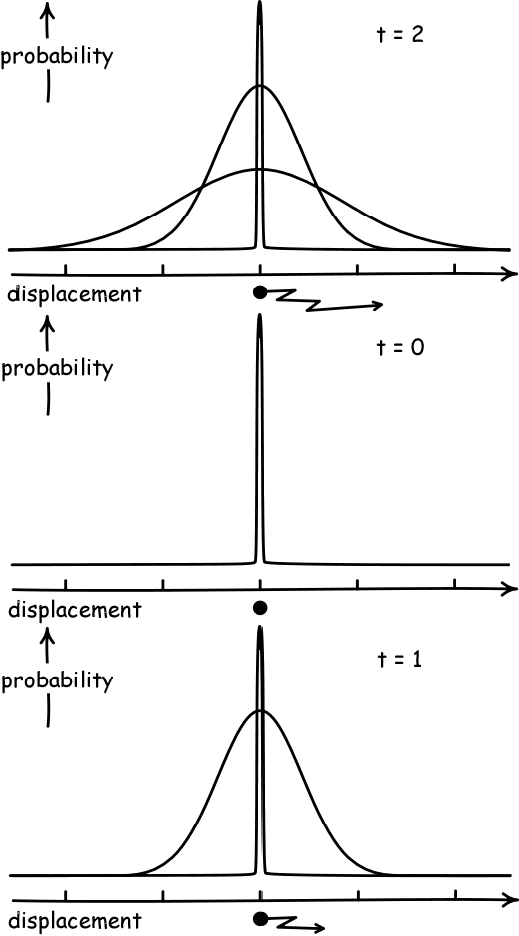
(Image Credit: John D. Norton)
Remember the case of the drunks leaving the bar: each one would follow a random path before collapsing, but on average, they would cluster around the bar door in a normal distribution. The random price hypothesis implies something similar: the rate of return of each individual stock can be modelled as a random walk, and so when trading closes for the day, the ending rates of return should cluster into a normal distribution.
If the rate of returns follow a random walk, then we know that they will be normally distributed. The price distribution that this gives rise to is called a log-normal distribution. Some typical log-normal distributions look like this.
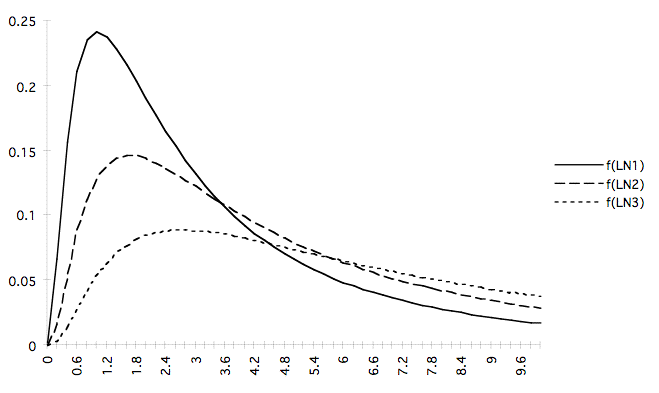
We can immediately notice one advantage of this model over the random price hypothesis: the log-normal distribution is always positive. So, at least we no longer have to worry about the problem of price.
It turns out that the logarithmic distribution solves our second problem as well: the effect of human psychology turns out to scale appropriately for a logarithmic price distribution, in that if an effect that gives rise to a £1 increase at the £10 price-range, the same effect will give rise to a £10 increase at the £100 price range, as we had intuitively suspected.
Is this enough reason to adopt the random rate of return hypothesis? How can we get a better idea which hypothesis is correct? One option would be to close our eyes and speculate further. A better option would be to look at some data. I suggest we now turn to the latter.
Empirical Consequences
Just like Maury Osborne did, we can today pick up the Wall Street Journal and look at the distribution of prices.
Osborne looked at the giant list of data listed in the Wall Street Journal and decided to just plot it all. There were only about 1,000 stocks in the New York Stock Exchange at the time. (There are now closer to 2,000.) So, Osborne divided the listed price per share into units between 0 and $140, and counted how many shares fell into each price bracket. In a now famous (1959) article, he drew the following plot.
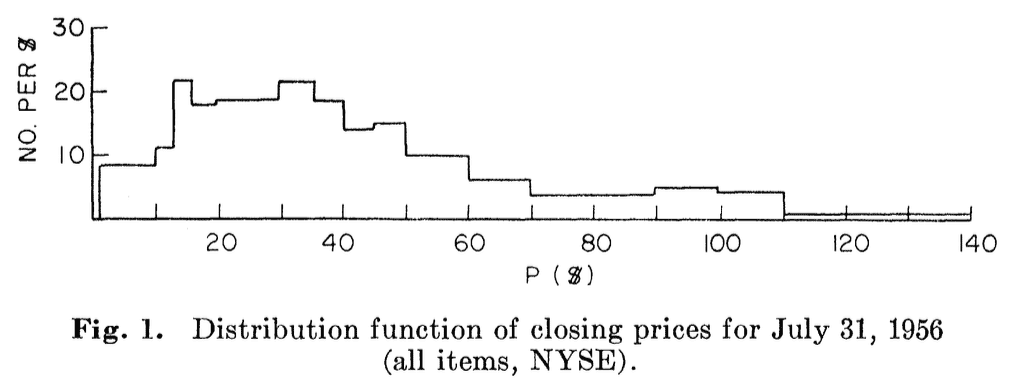
Osborne's famous (1959) log-normal plot.
The immediate, striking feature of this plot is that it is obviously not a normal distribution. However, it appears to match the log-normal distribution very well. Although far from obvious at the time, a picture can go many thousands of words, and Oxford's result immediately convinced the community the price of the stock market is (at least approximately) log-normally distributed.
We can easily repeat Osborne's procedure today on other markets, using data that is readily available online. Here are the results that a Master's student in this course plotted in the Spring of 2016, for the S&P500, Russel 3000, NASDAQ, and Oslo Exchange stock markets.
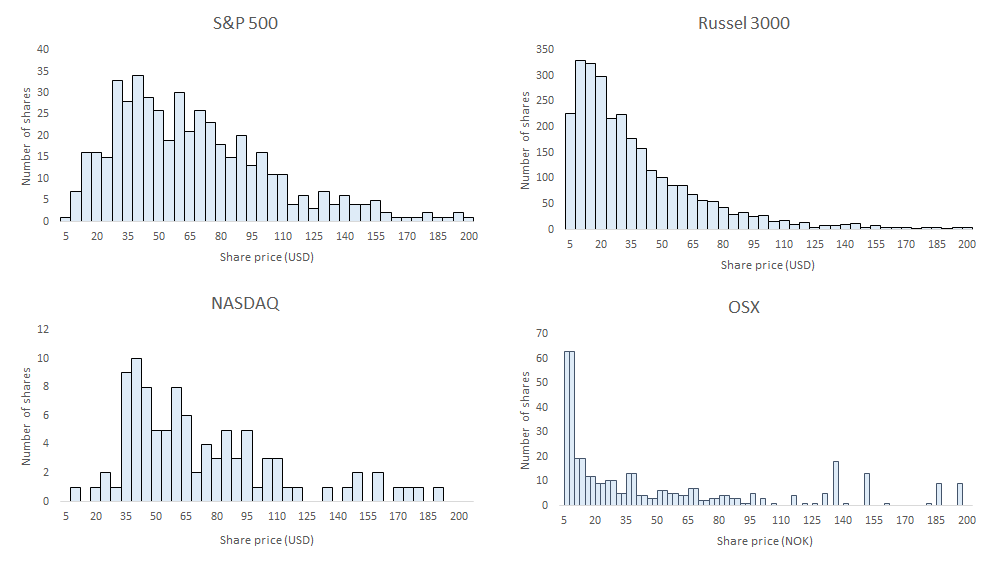
Plots by Morten Korsevein
In other words, the random rate of return hypothesis is more empirically accurate, in addition to the conceptual improvements that we discussed above. Curiously, the Russell 3000 fits a log-normal distribution particularly well, while the Oslo Exchange (OSX) does not. This indicates that there is a sense in which the securities in the large Russell 3000 satisfy the random rate of return hypothesis, while those in the small Oslo Exchange do not. What is the difference? You are invited to think this through.
Here's what Osborne wrote about the situation.
"Let us imagine that a statistician, trained perhaps in astronomy and totally unfamiliar with finance, is handed a page of the Wall Street Journal containing the N.Y. Stock Exchange (YSE) transaction for a given day. He is told that these data constitute a sample of approximately 1000 from some unknown population.
...[The statistician's] considerations have an obvious analogue in the diffusion of a molecule undergoing collisions with its neighbours. Regardless of the intermolecular force law... the dispersion in the probability distribution of position of a particle initially (at time t) located at some point will increase"
Along with this novel piece of data, Osborne also formalised the intuition we expressed above, that a financial change should be proportional to perception. He called this a consequence of the Weber-Fechner law, a rule formulated in the 18th and 19th centuries which claimed that the degree of human perception is proportional to the degree of stimulous. For example, if one light is objectively twice as bright as the other, then subjective human perception will proportionally perceive twice as much light.

Osborne claimed that "the difference in subjective sensation of profit (or loss), or change in value" associated with a stock or bond is equal to the change in its rate of return, i.e. to the logarithm of the price. This would provide further independent evidence that rates of return in a market are normally distributed, and thus follow a random walk.
Osborne finally adds:
"The phenomenon of the persistence of velocities, which the stock market also possesses, does not alter this conclusion."
In physics, the persistence of velocities is the fact that atoms don't 'forget' what happened to them earlier. The previous velocity has a persistent effect on the current state. Similarly with markets: the previous price or trade has a persistent effect on the future price; it is not truly 'forgotten'. But that is perfectly compatible with this statistical analysis, which is justified in the large scale.
Whether or not these precise details of Osborne's argument from the Weber-Fechner law succeed are up for debate. But importantly, notice that Osborne is doing much more than trying to fit a curve. He is developing a framework for relating small invisible changes to large visible effects.
The random walk investment strategy
Long-run growth
The random rate of return hypothesis suggests an investment strategy. The Chartist's prediction of near-term price changes no longer makes any sense: if prices are effectively random, then those people are doing little more than numerology. But if we don't trust the fundamentalist perspective (or don't have their ability to see the future), we don't even have to try to predict the individual behaviour of prices. Suppose that we simply bought a sampling of stocks that was representative of the entire market. How should we expect such a portfolio to behave in the long-run?
If the random rate of return hypothesis is correct, then rates of returns will cluster around their original price, and prices will logarithmically cluster around their original price. So, the net effect will be to stay the same. But as the market grows to include more people, more companies, and more money, our money will grow too. Such trends are indicated by the growing value of market indices, which are empirically observed to typically grow at a rate of around 7% over the course of 10 years.
This led economist Burton Malkiel put the strategy this way:
"[T]he advice was not literally to throw darts but instead to throw a towel over the stock pages — that is, to buy a broad-based index fund that simply bought and held all the stocks in the market and that charged very low expenses. I am more convinced than ever of the wisdom of that advice, and I am persuaded that those who take potshots at the market's random walk inevitably miss their target" (Malkiel 2007, pg.247)
Of course, a technical difficulty with this account is still the question of what a representative sampling is. Today, many financial products like index funds are sold that aim to be broadly representative of the market. However, the as a whole itself inevitably contains more securities than such a sampling can hope to include.
Concerns about the random walk account
As you might guess, fundamentalist investors and technical analysts are not generally pleased with the random rate of return approach to investing, which presented a direct challenge to both. It suggested that fundamentalist were engaged in fruitless attempts to predict individual prices, while chartists wasted time trying to identify 'trends' that are really best understood as a random walk. This led the investor Pierre Rinfret to take a dismal view of the random walk approach, claiming at an investor conference in 1968 that:
"random-walk theory is irrelevant, it is impractical, it is logically inconsistent, it is conceptually weak, it is limited in scope, and it is technically deficient."
James Vertin of Wells Fargo summed up the situation this way:
"You just don't win friends... by appearing to tell sincere, dedicated, intelligent people that they are useless dolts who could and should be replaced by computers".
Many of these claims amount to personal backlash, and Osborne's introduction of the log-normal price distribution model had an immediate and lasting impact on finance theory. The concern that the market is not really random is unfounded, since, as we have seen in the study of atomic theory, that fact is irrelevant to the question of whether or not the random walk hypothesis provides a reasonable way to analyse the bulk behaviour of a system.
However, there remain other more serious concerns. For example, our justification of the log-normal pricing model depends crucially on whether or not the assumptions of the random rate of return hypothesis hold. Recall from our original discussion that a random walk only occurs if each change is equal in size, equally likely to change in either direction, and independent of all previous changes. We only have a random walk with these three assumptions. Moreover, we can easily imagine circumstances in which assumptions like independence might fail, such as when investor "herd" mentality brings changes to depend importantly on previous ones. That said, the accuracy of log-normal price distributions suggests that such effects may on average cancel each other out.
In addition, as we will see next time, Mandlebroit and others developed evidence that the equal-step-size assumption may fail too. Thus, there is a general concern that the log-normal distribution is not quite correct either, and that other, less-controlled distributions may sometimes be necessary. This is an instance of a more general question: might the random rate of return hypothesis, like the random price hypothesis, be identifying the wrong parameter as following a random walk? And if we are mistaken about random rates of return, then what is the correct parameter?
One thing we can surely admit is that these models, both as Einstein used them and as Osborne did, rely on an approximation that reflects our ignorance of the underlying phenomenon. This holds both in physics and in finance, and it is what makes the model so successful in the first place. A more accurate model is therefore always possible. But the more difficult question of whether or not this is a problem, and of whether this is any less of a problem for physics than it is for finance, I leave to you.